Company URL: http://www.adamsaai.com/
Implementation URL: Active, restricted to employee use
Technology: HTML5/CSS3, Chartist.js, Pug (Jade), Express, Node.js, MongoDB
Goals/Concept: This project was a reporting application for a Job Corps company’s national IT team to display statistics and status of user submitted tickets from ZenDesk and Survey Monkey by each job center (named by location, i.e. Red Rock). The goal was to make navigation between reports simple, clear, and condensed enough to view a report without scrolling on vertically-short screens. Users could view reports for all centers or centers individually, so UI concept was to color code for Global areas (blue), individual center details (purple), and the report views (yellow) to help give a sense of where a user was in their viewing. Implementation included creating dynamic and responsive charting of center data.
Role: I wireframed, designed, and developed front-end layouts and implemented some javascript elements within the Pug templates. Project launched in less than 4 months.
IT Reporting Application Dashboard
Individual Center - Red Rock
Report View - Open Tickets for Red Rock
Report View - Overall Center Statistics
-

IT Reporting Application Dashboard
The main view and navigation point. User selects a month to view submitted issue-tracking tickets and then can click through to view statistics and statuses of tickets for individual centers in order to easily see center IT performance. -

Individual Center - Red Rock
View of ticket stats (number opened, closed) and charts (fully responsive with the use of chartist.js library), and local navigation to reports for that center. -

Report View - Open Tickets for Red Rock
Tabular display, only for details of open tickets for one individual center. Duration of open tickets converted for display using moment.js library. -

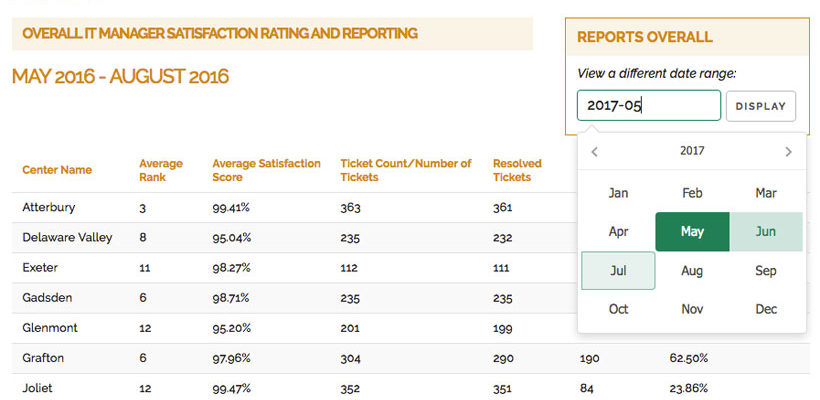
Report View - Overall Center Statistics
View can be for a single month or for a range of months in order to see all centers at a glance. Datepicker library used was air-datepicker.js for its ability to handle multi-selection.